![Joint Exploration of the Twilight Zone Ocean Network [logo]](/themes/jetzon-NOC8X/logo.svg)
Galí, M., Orihuela-García, M. A., Ruprich-Robert, Y., Lapin, V., Sánchez-Urrea, M., Fontela, M., Llort, J., Sicardi, V., & Bernardello, R. (2026). Convection injects labile particulate organic carbon to the deep ocean. Science Advances, 12(31), eaee6883.
https://doi.org/doi:10.1126/sciadv.aee6883
Vertical fluxes of particulate organic carbon (POC) are central to the oceanic carbon cycle, yet the role and interannual variability of convective POC transport remain poorly constrained. Autonomous profilers drifting in the Labrador and Irminger Seas detected recurrent winter-spring chlorophyll-a fluorescence peaks at 1000 m during intense convection in 2014–2017. The bio-optical properties of the particles indicate deep mixing of surface POC rich in labile phytoplanktonic material, distinct from both background suspended particles and sinking aggregates. Model simulations show that the mixing-driven POC supply to the deep ocean (500–2000 m) scales with convection volume (R2 ≈ 0.88) and is typically dominated by planktonic biomass. According to the model, vertical mixing regionally contributes ~33–44% of the combined POC supply from mixing and sinking to the 500–2000 m layer during strong convection years. These convective injection episodes likely reshape deep-ocean carbon budgets by enhancing metabolism and driving lateral exports, linking upper-ocean dynamics to deep-ocean water masses and ecosystems.
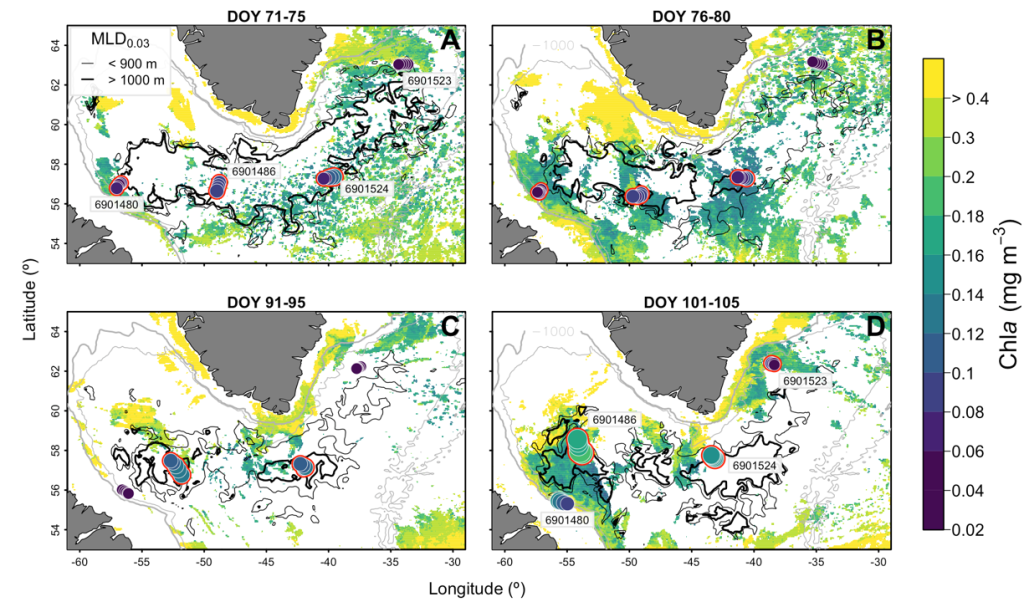
Caption: Deep convection signature in sea-surface and 1000-m chlorophyll concentration. Panels show four periods between mid-March and mid-April 2015 (DOY, day of year) capturing the transition from maximal convection extent (A) through relaxation (B, C) to reintensification (D). Each panel shows the 5-day average satellite-derived chlorophyll a (Chla) from OC-CCIv6, and the daily-mean fluorescence (ΔFChla) at 1000 m from BGC-Argo floats (colored dots). Sequences of overlapping dots correspond to individual floats (labels in A and D), with more recent data plotted on top. Dot size is scaled to Chla. Red circles indicate weak stratification (<0.03 kg m-3) in 0–1000 m Argo float profiles. Black contours show MLD_0.03 from the GLORYS12v1 reanalysis, distinguishing areas where MLD_0.03 consistently exceeded 1000 m (thick lines) from those where MLD_0.03 never exceeded 900 m (thin lines) during each period. Gray contours show the 1000 and 2000 m isobaths.
- Log in to post comments